Updates & News 31 August 2018

Building a UI for the k6 load testing tool

Ragnar Lönn

This article describes how to build an external command-and-control UI for exploratory load testing with k6. The UI is written in Python and features some awesome ASCII graphics using the Python curses library.

Screen Shot 2018-07-01 at 23.15.51

The resulting little Python app actually implements a feature that, at the time of writing, you cannot get anywhere else: the ability to dynamically alter the load level of a running load test!

This lets you do "exploratory" load testing with k6, where you start your load test at some fixed load level and then adjust the load up or down during the test, depending on what you see happening on the target system. Just press "+" or "-" on your keyboard to alter the load level! You can also pause the whole test - temporarily halting all traffic - with the push of a button. Cool, isn't it?

The Python code can be found at https://github.com/ragnarlonn/k6control if you want to contribute. Feel free also to steal things and build your own UI of course!

Note that this article assumes you're already familiar with k6 and that you have some software development skillz (even better if you've used Python a bit).

The k6 REST API

As described in the previous article, k6 will by default fire up an API server on TCP port 6565, where it exposes the command-and-control API. Currently there are only a small number of things you can do via this API, but hopefully in the future it will be extended with more end points. Here is a description of the API, in full (reddish text is server response):

GET /v1/status

Get status data for the running test:

$ curl -X GET localhost:6565/v1/status
{
"data": {
"type": "status",
"id": "default",
"attributes": {
"paused": true,
"vus": 1,
"vus-max": 10,
"running": true,
"tainted": false
}
}
}

PATCH /v1/status

Update status data for the running test (here we set paused=false, and the server returns the newly updated status):

$ curl -X PATCH -d
{
"data": {
"type": "status",
"id": "default",
"attributes": {
"paused": false,
"vus": 1,
"vus-max": 10,
"running": true,
"tainted": false
}
}
}

localhost:6565/v1/status

{
"data": {
"type": "status",
"id": "default",
"attributes": {
"paused": false,
"vus": 1,
"vus-max": 10,
"running": true,
"tainted": false
}
}
}

GET /v1/metrics

Get all metrics:

$ curl -X GET localhost:6565/v1/metrics
{
"data": [
{
"type": "metrics",
"id": "vus",
"attributes": {
"type": "gauge",
"contains": "default",
"tainted": null,
"sample": { "value": 1 }
}
},
{
"type": "metrics",
"id": "vus_max",
"attributes": {
"type": "gauge",
"contains": "default",
"tainted": null,
"sample": { "value": 10 }
}
}
]
}

GET /v1/metrics/

Get a specific metric:

$ curl -X GET localhost:6565/v1/metrics/vus{
{
"data":{"type":"metrics","id":"vus","attributes":{"type":"gauge","contains":"default","tainted":null,"sample":{"value":1}}}}
}

GET /v1/groups

Get all defined groups:

$ curl -X GET localhost:6565/v1/groups
{
"data": [
{
"type": "groups",
"id": "d41d8cd98f00b204e9800998ecf8427e",
"attributes": { "path": "", "name": "", "checks": null },
"relationships": { "groups": { "data": [] }, "parent": { "data": null } }
}
]
}

GET /v1/groups/

Get a specific group:

$ curl -X GET localhost:6565/v1/groups/d41d8cd98f00b204e9800998ecf8427e
{
"data": {
"type": "groups",
"id": "d41d8cd98f00b204e9800998ecf8427e",
"attributes": { "path": "", "name": "", "checks": null },
"relationships": { "groups": { "data": [] }, "parent": { "data": null } }
}
}

That’s really it! You use the five GET end points to get live information from a running test, and you use the PATCH end point to control the test: change number of VUs and pause/resume the test (currently, there is no way to abort the test using the API).

The Python app

So now we know what the API looks like, and what it can do. Time to write some code to actually do it!

Some general information before we dive in:

  • I'm using the Python requests library to issue HTTP requests to the k6 API server<
  • The Python curses library enables the jaw-dropping graphix
  • The code is following every single PEP directive for coding standards... Not! Maybe some of them. Perhaps. Better not use this code to teach people Python.

The first try

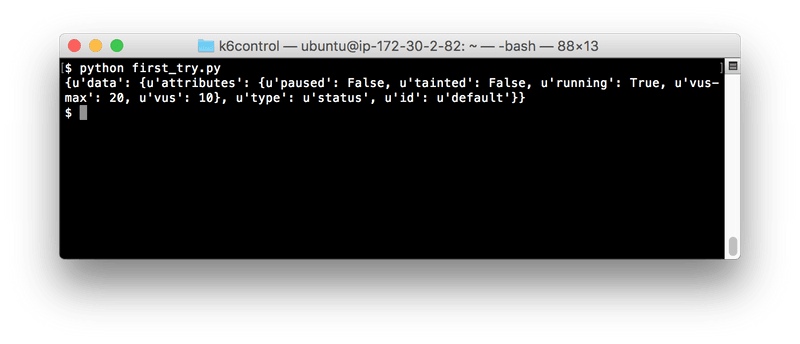
So. Where to start? The simplest thing we can do is probably GETting and displaying the overall status of a running load test, using the GET /v1/status end point. Let's try that - here is the Python code:

// $ cat first_try.py
import requests
r = requests.get("http://localhost:6565/v1/status")
print r.json()

That should do it. Then we fire up a k6 instance. I'm using a simple k6 test script that looks like this:

// $ cat script.js
import http from "k6/http";
import { sleep } from "k6";
export let options = {
vus: 10,
vusMax: 20,
duration: "3m"
};
export default function() {
let res = http.get("http://httpbin.org/");
sleep(Math.random() * 2);
};

Tip: sleeping a random amount of time between iterations is often useful as it means VUs will not operate in sync. You usually don't want all your VUs to issue requests at the exact same time

So, first we execute k6 like this:

$ k6 run --linger script.js

Tip 2: use the --linger command-line flag to tell k6 not to exit after the test has finished, and to keep the API server available all the time

And after starting k6 we run our Python program in another terminal window:

Screen Shot 2018-07-02 at 20.52.02

Well, that worked. The app fetched some status info from the running k6 instance and printed it onscreen.

Version 2

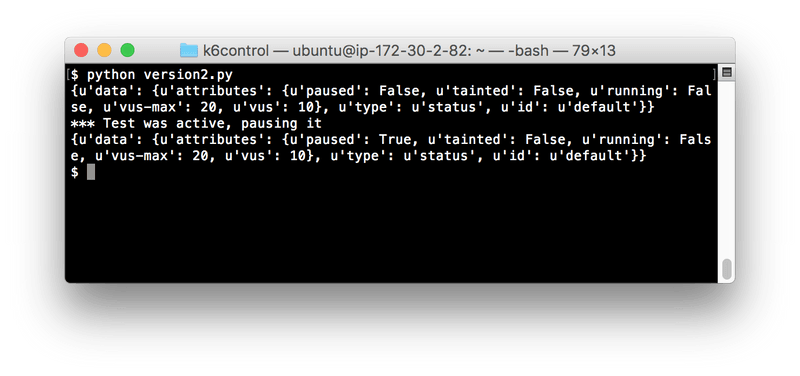
So let's try changing the state of the test with the app. First we read the status, then we use the PATCH /v1/status end point to change the "paused" state of the app, then we read the status again to verify that we managed to pause the test.

# $ cat version2.py
import requests
import json
r = requests.get("http://localhost:6565/v1/status")
status_response = r.json()
print status_response
paused = status_response['data']['attributes']['paused']
if paused:
print "*** Test was paused, unpausing it"
else:
print "*** Test was active, pausing it"
status_response['data']['attributes']['paused'] = not paused
requests.patch("http://localhost:6565/v1/status", data=json.dumps(status_response))
r = requests.get("http://localhost:6565/v1/status")
print r.json()

This what happens when we run the program:

Screen Shot 2018-07-02 at 15.59.49

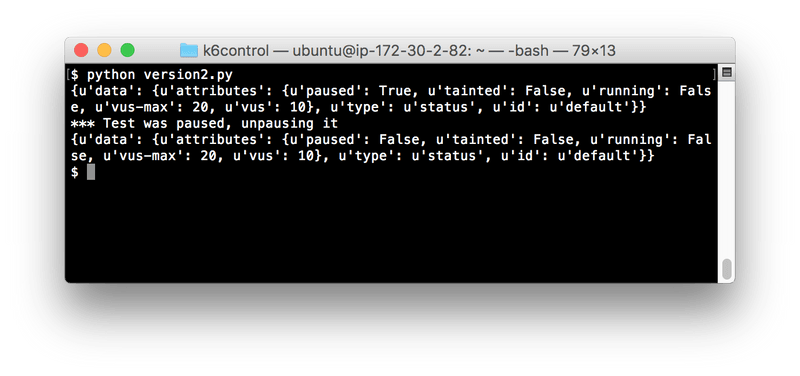
And if the k6 test was still running you'll note that execution (load generation) will have stopped at this point. We can run our program again to make k6 resume the load test:

Screen Shot 2018-07-02 at 16.00.57

Increase & decrease VU level

So now that we know how to change the status of a running test we of course want to be able to manipulate the load level of the test. Let's create a small app for that:

# $ cat add_remove_vus.py
import requests
import json
import sys
def usage():
print "Usage: %s <add x> | <remove x>" % sys.argv[0]
print ""
sys.exit(1)
if len(sys.argv) < 3:
usage()
try:
vumod = int(sys.argv[2])
except:
usage()
if sys.argv[1] == "remove":
vumod = -vumod
r = requests.get("http://localhost:6565/v1/status")
status_response = r.json()
print status_response
vulevel = status_response['data']['attributes']['vus']
vumax = status_response['data']['attributes']['vus-max']
if vulevel + vumod < 0:
print "Cannot decrease vus below 0"
sys.exit(1)
if vulevel + vumod > vumax:
print "Cannot increase vus above vus-max (currently set to: %d)" % vumax
sys.exit(1)
status_response['data']['attributes']['vus'] = vulevel + vumod
requests.patch("http://localhost:6565/v1/status", data=json.dumps(status_response))
r = requests.get("http://localhost:6565/v1/status")
print r.json()

Live statistics for a test

Now we want to follow a test in real time, keeping track of how many requests/second etc. k6 is generating. We'll use the GET /v1/metrics end point to retrieve all metrics from k6. If we just want a single metric (like the "http_reqs" metric - a counter keeping track of how many HTTP requests k6 has made), we can GET /v1/metrics/http_reqs. We'll start by using the latter end point, for clarity (less response data to sift through).

$ curl 'http://localhost:6565/v1/metrics/http_reqs'
{
"data": {
"type": "metrics",
"id": "http_reqs",
"attributes": {
"type": "counter",
"contains": "default",
"tainted": null,
"sample": { "count": 228, "rate": 8.957946377126675 }
}
}
}

But something's wrong with this data! I.e. it doesn't work for our purpose: we want to show the current HTTP requests/second rate, but this metric provides a "rate" value that is calculated for the whole load test. That means that if we, for example run a load test that generates 10 HTTP requests/second for 10 minutes and then suddenly there is a spike to 100 requests/second, this rate metric would take maybe 30 seconds to change visibly, and even then it would not show the actual current 100 req/s rate. That's not much fun. We want our UI app to show traffic spikes as they happen, when they happen.

k6 does not provide point-in-time rate values for its counter metrics (maybe that is something that could be implemented in the future?) so we have to calculate those metrics ourselves here. The way to do that is of course to poll k6 for the cumulative counter value, at two different points in time, and then calculate what the rate was between those two points in time. Like this:

$ curl 'http://localhost:6565/v1/metrics/http_reqs'
{
"data": {
"type": "metrics",
"id": "http_reqs",
"attributes": {
"type": "counter",
"contains": "default",
"tainted": null,
"sample": { "count": 287, "rate": 8.513744198603883 }
}
}
}
{
"data": {
"type": "metrics",
"id": "http_reqs",
"attributes": {
"type": "counter",
"contains": "default",
"tainted": null,
"sample": { "count": 331, "rate": 8.546286459840935 }
}
}
}

Here we can see that the "http_reqs" counter metric changed from 287 to 331 over 5 seconds. That means that k6 generated 331-287=44 requests during those 5 seconds. That is 8.2 requests/second.

Let's write a small Python program that displays live rates for some interesting k6 counter metrics:

import requests
import datetime
import json
from time import sleep
refresh_interval = 5
metrics = []
def main():
global metrics, refresh_interval
while True:
metric_data = fetch()
t = datetime.datetime.now()
metrics.append( (t, metric_data) )
if len(metrics) > 1:
http_reqs = get_rate("http_reqs")
iterations = get_rate("iterations")
data_sent = get_rate("data_sent")
data_received = get_rate("data_received")
print "%s: reqs/s: %0.1f Iterations/s: %0.1f Bytes IN/s: %0.1f Bytes OUT/s: %0.1f" % \
( datetime.datetime.now().strftime("%H:%M:%S"), http_reqs, iterations, data_received, data_sent )
sleep(refresh_interval)
def get_rate(metric_name):
global metrics
latest_fetch = metrics[-1][1]
latest_timestamp = metrics[-1][0]
previous_fetch = metrics[-2][1]
previous_timestamp = metrics[-2][0]
delta = latest_fetch[metric_name]['data']['attributes']['sample']['count'] - \
previous_fetch[metric_name]['data']['attributes']['sample']['count']
interval = metrics[-1][0] - metrics[-2][0]
rate = float(delta) / float(interval.seconds)
return rate
def fetch():
r1 = requests.get("http://localhost:6565/v1/metrics/http_reqs").json()
r2 = requests.get("http://localhost:6565/v1/metrics/iterations").json()
r3 = requests.get("http://localhost:6565/v1/metrics/data_sent").json()
r4 = requests.get("http://localhost:6565/v1/metrics/data_received").json()
return { "http_reqs": r1, "iterations": r2, "data_sent": r3, "data_received": r4 }
if __name__ == "__main__":
main()

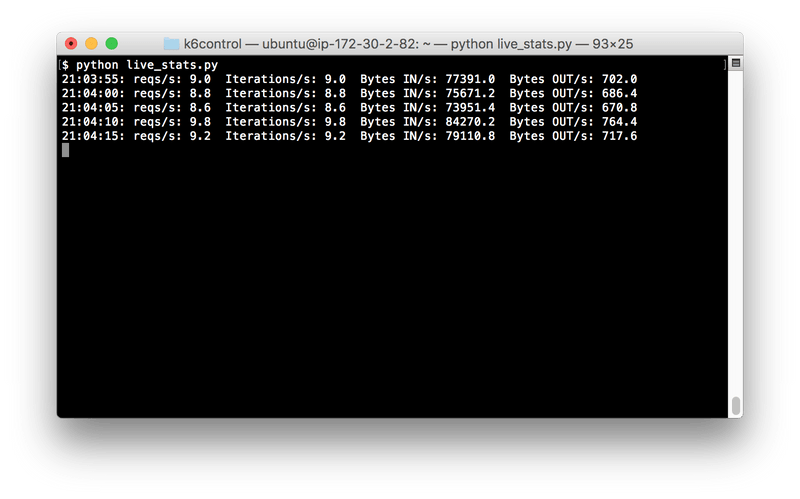
This looks better. Here is the output:

Screen Shot 2018-07-02 at 21.04.16

The numbers are updated live every 5 seconds, and shows the rates for the past 5 second period only, so it will catch a sudden change in traffic.

But where are the graphix!?

A command-and-control UI for a load testing app would be boring if it didn't have the ability to draw some kind of chart. And featured single-key commands - It has to feel a bit more like a game! And it needs retro-terminal-inspired colors!

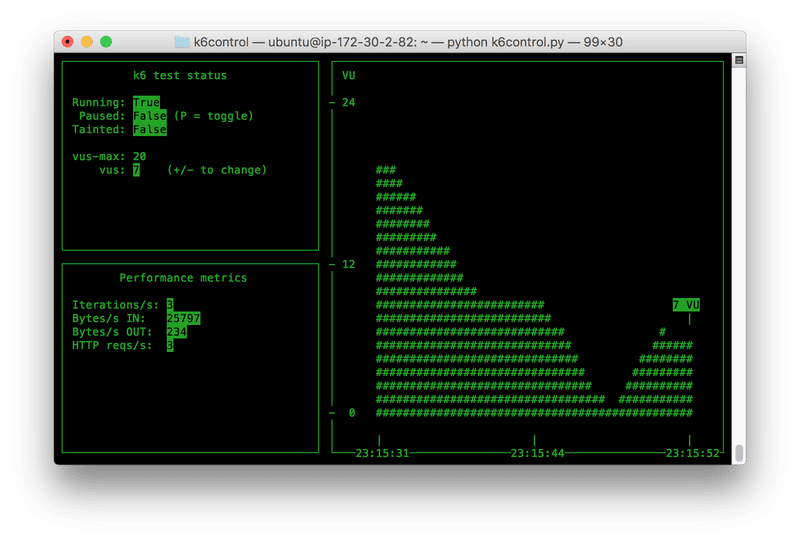
So we'll do a bit of refactoring, add a couple of features and also introduce curses into the mix. Then we get...THIS:

Screen Shot 2018-07-01 at 23.15.51

Oops, suddenly we're at 300 lines of code - That went fast. I guess I could have continued describing each step along the way here, but the blog article would have become more or less a (not so fantastic) tutorial for the curses library. I think instead that I'll quickly describe the code and direct you to the Gihub repo.

If you just want to try out this nifty little app, you can just go to the releases page and download a ZIP file with the Python code. Unzip it, then run python k6control.py.

k6control

Yeah, that's what I named it. Nothing wrong with my imagination, as you can see. But anyway, the code is included at the end of the article also, in case you happen to have MAXINT browser windows open and can't open a single one more.

A quick description of what the code does:

  1. main() gets executed
  2. main() parses command-line options, then executes the run() function via curses.wrapper(), which helps resetting the terminal to a sane/usable state in case the program should exit via an uncaught exception, or something similar
  3. run() is the actual "main" function here. It does a lot of things:
  4. It creates a "Communicator" object, which will fetch data from the running k6 instance
  5. It sets some global curses options
  6. It makes the Communicator object fetch some initial data from the running k6 instance
  7. It creates three curses windows: one "status window", one "vu window" and one "metrics window"
  8. Then it enters the run loop, where it looks for keyboard input or terminal resize events, and acts on them

These are the three curses-defined, on-screen windows:

  1. The Status window on the upper left contains general information about the test - whether it is running or not (if it is not, it means the test has finished), if it is paused or not (a paused test can still be "running"), how many active VUs there are currently, and things like that. Basically all the data you get from a call to the /v1/status API end point
  2. The VU window takes up the whole right side of the terminal. It displays a graph of the historical VU levels during the test. Note that the graph has a fixed & limited time range that it can display, and it updates continuously so if k6control has been running a while you will not be able to see the whole history of the load test in the graph.
  3. The Metric window is on the left side, below the Status window. It shows the current state of a few performance metrics: bytes sent and received per second, HTTP requests made per second, and script iterations per second.

There is one class instantiated as an object for each window. The window objects contain functionality for populating the windows with information and for resizing them in case the terminal window is resized.

There is also one class (Communicator) that handles all the data fetching from the running k6 instance. It saves all old data it has fetched, with time stamps. This allows the program to calculate delta values for several counter metrics - i.e. calculate how much a metric has changed since last time it was fetched. This means we can calculate things like current number of HTTP requests/second, etc.

The Communicator object should probably have handled the outgoing PATCH requests also, which are now sent from the run() function directly. Ah well, future improvements.

Command-line options

Run the program with the -h/--help flag to see the built-in help text

Basically, you can do these three things:

  • Specify where the running k6 instance is:

    python k6control.py -a http://localhost:1234
    python k6control.py --address=http://localhost:1234

  • Change how frequently data should be fetched from the k6 instance:

    python k6control.py -i 5 // fetch every 5 seconds
    python k6control.py --interval=5

  • How many VUs to be added/removed with +/- controls:

    python k6control.py -v 5
    python k6control.py --vumod 5

Build something!

This whole project, and the article, was meant to demonstrate how easy it is to integrate/interface with k6, in the hope that someone reading this gets inspired to build something themselves.

If you like the app and want to contribute, I'd absolutely accept pull requests (provided they are reasonably sane), but like I wrote earlier you're also very welcome to take the code, or parts of it, and use on your own. If you build something cool, we in the k6 community would love to hear about it - feel free to announce it in e.g. the k6 Slack channels.
And finally, here is the code!

import sys
import time
import json
import getopt
import datetime
import requests
import curses
from math import log10, pow
k6_url = "http://localhost:6565"
refresh_interval = 1
vumod = 1
def main():
global k6_url, refresh_interval, vumod
try:
opts, args = getopt.getopt(sys.argv[1:], "iv:h", ["interval=","address=","vumod=","help"])
except getopt.GetoptError as err:
print str(err)
usage()
sys.exit(1)
for o, a in opts:
if o in ("-i", "--interval"):
try:
refresh_interval = int(a)
except:
usage()
sys.exit(1)
elif o in ("-a", "--address"):
k6_url = a
elif o in ("-v", "--vumod"):
try:
vumod = int(a)
except:
usage()
sys.exit(1)
else:
usage()
if not o in ("-h", "--help"):
sys.exit(1)
sys.exit(0)
# Execute the run() function via the curses wrapper
curses.wrapper(run)
def run(stdscr):
global k6_url, refresh_interval, vumod
# Create a Communicator object that can talk to the running k6 instance
k6 = Communicator(k6_url)
# Init curses
curses.start_color()
curses.init_pair(1, curses.COLOR_GREEN, curses.COLOR_BLACK)
curses.curs_set(0)
stdscr.nodelay(True)
stdscr.clear()
# Fetch some initial data from k6
k6.fetch_data()
last_fetch = time.time()
start_time = last_fetch
# Init onscreen curses windows
vu_window = VUWindow(stdscr)
vu_window.update(k6)
status_window = StatusWindow(stdscr)
status_window.update(k6)
metrics_window = MetricsWindow(stdscr)
metrics_window.update(k6)
stdscr.refresh()
update = False
# Main loop
while True:
c = stdscr.getch()
# 'Q' quits the program
if c == ord('q') or c == ord('Q'):
return
if c == ord('p') or c == ord('P'):
# PATCH back last status msg, with "paused" state inverted
payload = {"data":k6.status[-1][1]}
payload['data']['attributes']['paused'] = (not payload['data']['attributes']['paused'])
r = requests.patch(k6_url + "/v1/status", data=json.dumps(payload))
k6.fetch_status()
update = True
if c == ord('+'):
# PATCH back last status msg, with "vus" increased
payload = {"data":k6.status[-1][1]}
payload['data']['attributes']['vus'] = payload['data']['attributes']['vus'] + vumod
r = requests.patch(k6_url + "/v1/status", data=json.dumps(payload))
k6.fetch_status()
update = True
if c == ord('-'):
# PATCH back last status msg, with "vus" decreased
payload = {"data":k6.status[-1][1]}
payload['data']['attributes']['vus'] = payload['data']['attributes']['vus'] - vumod
r = requests.patch(k6_url + "/v1/status", data=json.dumps(payload))
k6.fetch_status()
update = True
# Check for a terminal resize event and recalculate window sizes if there was one
if c == curses.KEY_RESIZE:
stdscr.erase()
vu_window.resize()
status_window.resize()
metrics_window.resize()
update = True
# If new data has been fetched or terminal has been resized, recreate window contents
if update:
vu_window.update(k6)
status_window.update(k6)
metrics_window.update(k6)
update = False
# If it is time to fetch new data, do so and set update flag so window contents will be recreated
if time.time() > (last_fetch + refresh_interval):
k6.fetch_data() # this can take a bit of time = fairly likely a terminal resize event happens
last_fetch = time.time()
update = True # don't update windows immediately, in case terminal has been resized
# Tell curses to update display, if necessary
curses.doupdate()
# This thing handles communication with the running k6 instance
class Communicator:
def __init__(self, k6_address):
self.k6_address = k6_address
self.status = []
self.metrics = []
self.vus = []
def fetch_status(self):
t = datetime.datetime.now()
r = requests.get(self.k6_address + "/v1/status")
data = r.json()['data']
self.status.append((t, data))
self.vus.append((t, data['attributes']['vus']))
def fetch_metrics(self):
t = datetime.datetime.now()
r = requests.get(self.k6_address + "/v1/metrics")
data = r.json()['data']
self.metrics.append((t, data))
def fetch_data(self):
self.fetch_status()
self.fetch_metrics()
# This is the window that displays the live VU level
class VUWindow:
def __init__(self, stdscr):
self.stdscr = stdscr
self.resize()
def resize(self):
stdscr_height, stdscr_width = self.stdscr.getmaxyx()
self.height = stdscr_height
self.width = int(0.6 * stdscr_width)
self.win = self.stdscr.subwin(self.height, self.width, 0, int(stdscr_width*0.4+0.5))
self.win.bkgd(' ', curses.color_pair(1))
self.chart_width = self.width - 12
self.chart_height = self.height - 7
def update(self, data):
self.win.clear()
self.win.box()
# We can display chart_width # of data points - retrieve that many
if len(data.vus) > self.chart_width:
points = data.vus[-self.chart_width:]
else:
points = data.vus
if len(points) < 1:
return
# Find largest sample value in the series, and first and last timestamp
maxval = 0
for point in points:
t, val = point
if val > maxval:
maxval = val
# Calculate an appropriate range and tick interval for the Y axis
if maxval > 0:
magnitude = int(pow(10, log10(maxval)))
ymax = int(magnitude * int(maxval/magnitude) * 1.2)
else:
ymax = 1
ytick = float(ymax) / 2.0
# Calculate an appropriate tick interval for the X (time) axis
xtick = (points[-1][0] - points[0][0]) / 3
# Plot X and Y axis ticks
self.win.addstr(1, 2, "VU")
for i in range(3):
ypos = 3 + self.chart_height - int( (float(self.chart_height)/2.0) * float(i) )
s = str(int(i * ytick))
self.win.addstr(ypos, 1 + 2-int(len(s)/2), s)
self.win.addstr(ypos, 0, "-")
# Plot the values
for i in range(len(points)):
bar_position = 7 + self.chart_width - len(points) + i
t, val = points[i]
bar_height = int(float(self.chart_height) * (float(val)/float(ymax)))
self.win.vline(4 + self.chart_height - bar_height, bar_position, '#', bar_height)
if i==0 or i==self.chart_width-1 or i==int((self.chart_width-1)/2):
self.win.addstr(self.height-2, bar_position, "|")
self.win.addstr(self.height-1, bar_position - 3, t.strftime("%H:%M:%S"))
if i==len(points)-1:
s = "%d VU" % val
self.win.addstr(1 + self.chart_height - bar_height, bar_position - int(len(s)/2), s, curses.A_REVERSE)
self.win.addstr(2 + self.chart_height - bar_height, bar_position, "|")
self.win.noutrefresh()
# This window displays general test information
class StatusWindow:
def __init__(self, stdscr):
self.stdscr = stdscr
self.resize()
def resize(self):
stdscr_height, stdscr_width = self.stdscr.getmaxyx()
self.height = stdscr_height / 2
self.width = int(stdscr_width*0.4)
self.win = self.stdscr.subwin(self.height, self.width, 0, 0)
self.win.bkgd(' ', curses.color_pair(1))
def update(self, data):
self.win.clear()
self.win.box()
status = data.status[-1][1]['attributes']
self.win.addstr(1, (self.width-14)/2-1, "k6 test status")
self.win.addstr(3, 2, "Running: ")
self.win.addstr(3, 11, str(status['running']), curses.A_REVERSE)
self.win.addstr(4, 2, " Paused: ")
self.win.addstr(4, 11, str(status['paused']), curses.A_REVERSE)
self.win.addstr(4, 17, "(P = toggle)")
self.win.addstr(5, 2, "Tainted: ")
self.win.addstr(5, 11, str(status['tainted']), curses.A_REVERSE)
self.win.addstr(7, 2, "vus-max: %d" % status['vus-max'])
self.win.addstr(8, 6, "vus: ")
self.win.addstr(8, 11, str(status['vus']), curses.A_REVERSE)
self.win.addstr(8, 16, "(+/- to change)")
self.win.noutrefresh()
# This window displays general test information
class MetricsWindow:
def __init__(self, stdscr):
self.stdscr = stdscr
self.resize()
def resize(self):
stdscr_height, stdscr_width = self.stdscr.getmaxyx()
self.height = stdscr_height - (stdscr_height / 2)
self.width = int(stdscr_width*0.4)
self.win = self.stdscr.subwin(self.height, self.width, stdscr_height / 2, 0)
self.win.bkgd(' ', curses.color_pair(1))
def update(self, data):
self.win.clear()
self.win.box()
self.win.addstr(1, (self.width-19)/2-1, "Performance metrics")
if len(data.metrics) > 2:
metrics = [
( "iterations", "Iterations/s: ", 0),
( "data_received", "Bytes/s IN: ", 0),
( "data_sent", "Bytes/s OUT: ", 0),
( "http_reqs", "HTTP reqs/s: ", 0)
]
interval = data.metrics[-1][0] - data.metrics[-3][0]
for metric in data.metrics[-1][1]:
for i, t in enumerate(metrics):
if metric['id'] == t[0]:
metrics[i] = (metrics[i][0], metrics[i][1], metric['attributes']['sample']['count'])
for metric in data.metrics[-3][1]:
for i, t in enumerate(metrics):
if metric['id'] == t[0]:
delta = t[2] - metric['attributes']['sample']['count']
rate = str(delta / interval.seconds)
self.win.addstr(3+i, 2, t[1])
self.win.addstr(3+i, 2 + len(t[1]), rate, curses.A_REVERSE)
self.win.noutrefresh()
def usage():
print "Usage: k6control [options]"
print ""
print "Options:"
print " -a <k6_address> Specify where the running k6 instance"
print " --address=<k6_address> is that we want to control"
print " -i <seconds> How often should k6control refresh data"
print " --interval=<seconds> and plot new points in the VU graph"
print " -v <vus> How many VUs to add or remove when using"
print " --vumod=<vus> the +/- controls to add or remove VUs"
print " -h Show this help text"
print " --help"
print ""
if __name__ == "__main__":
main()
< Back to all posts